
Tableau portfolio
Data worth
exploring.
A clearer view of business performance, from the headline numbers to the stories behind them.
Explore the dashboard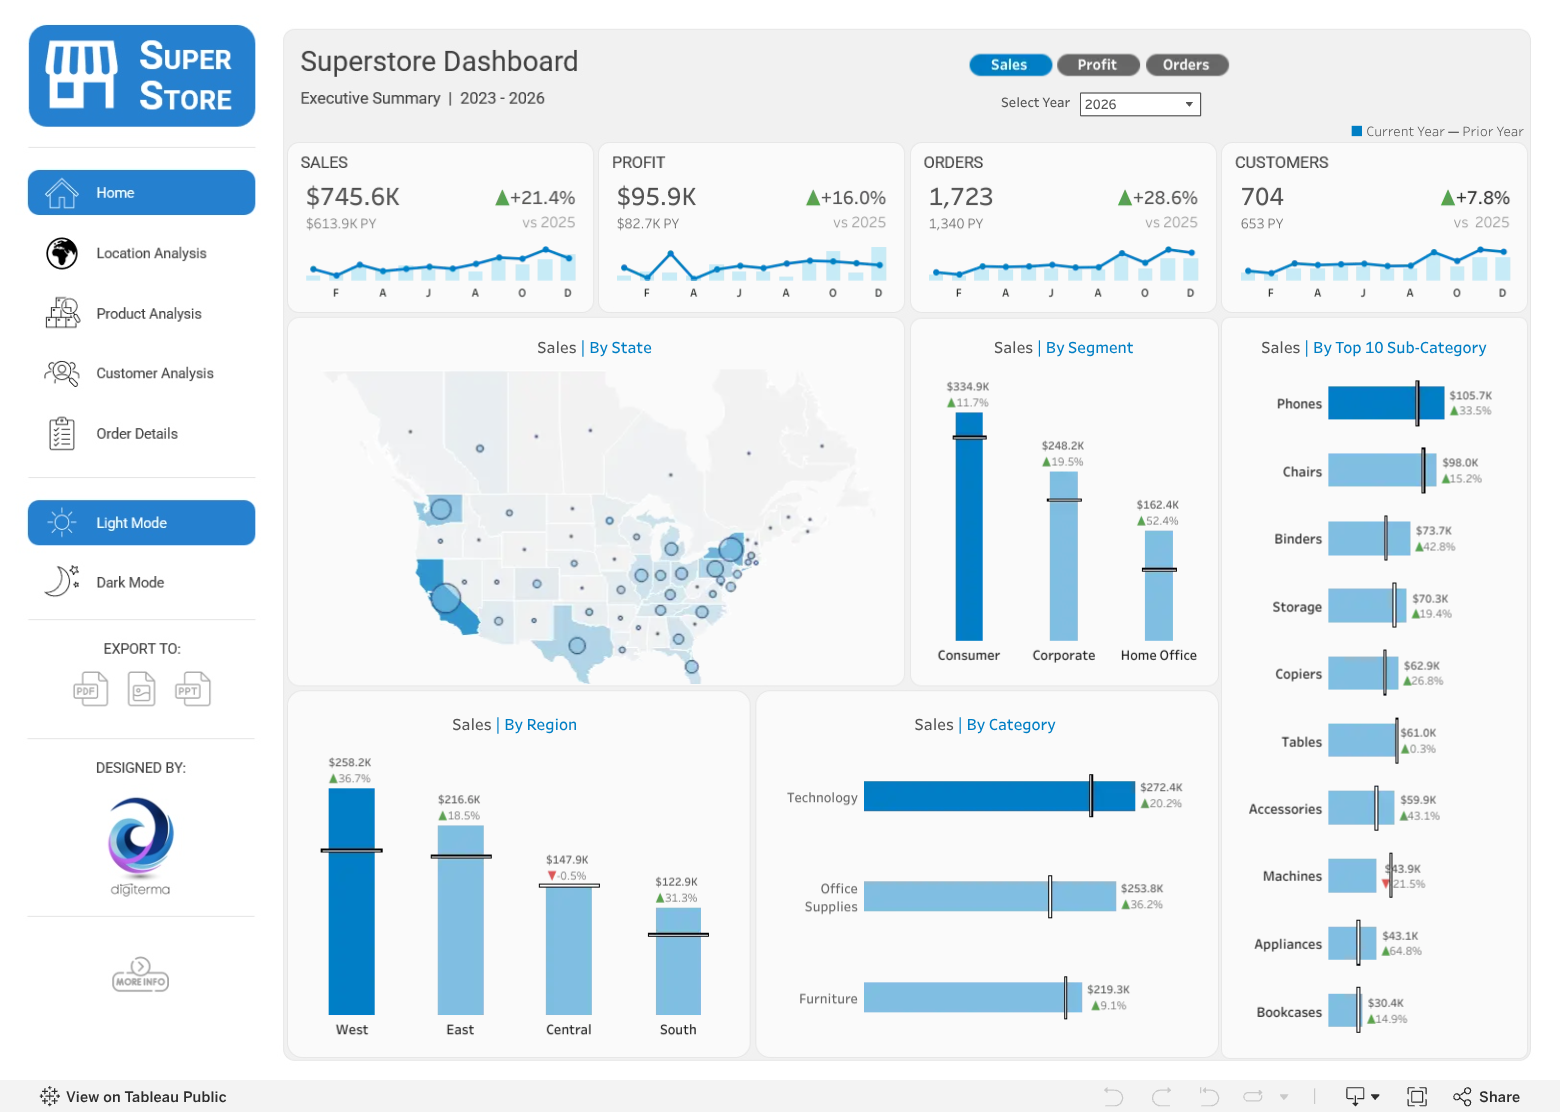
The business.
The bigger picture.
Explore the Superstore executive summary, then look closer at locations, products, customers and individual orders.
Connecting to Tableau…
You can view the snapshot while it loads.One dataset.
Multiple perspectives.
A connected dashboard that moves from a business overview to the detail behind performance.
- Platform
- Tableau Public
- Focus
- Retail performance
- Format
- Interactive dashboard
Start with the big picture
Compare sales, profit, orders and customers with the prior year. Monthly trends give each headline number context.
Find the geographic story
Explore the US sales map and regional comparisons, then open Location Analysis to investigate performance across places.
Look closer at products and customers
Compare categories, sub-categories and customer segments. Product Analysis and Customer Analysis provide another level of detail.
Get down to the order
Use Order Details to move from aggregated trends to the records behind them. Switch between light and dark mode inside the dashboard.
What could your
data make clearer?
Explore the project in Tableau, or talk through a question about your own business.